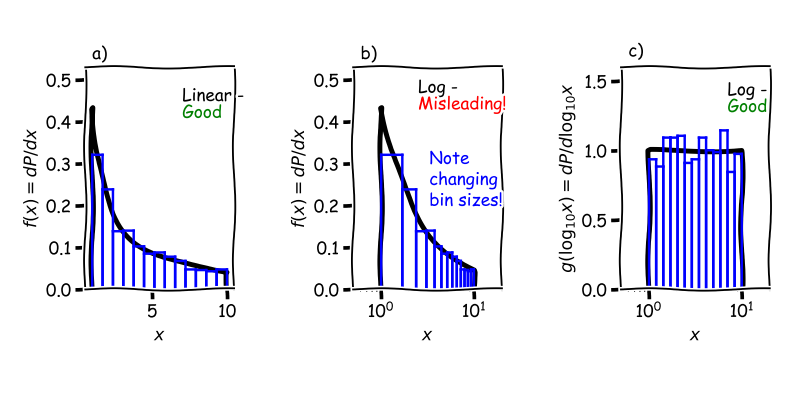
In the course of doing astronomy, one often encounters plots of densities, for example probability densities, flux densities, and mass functions. Quite frequently the ordinate of these diagrams is plotted logarithmically to accommodate a large dynamic range. In this situation, I argue that it is critical to adjust the density appropriately, rather than simply setting the x-scale to `log' in your favorite plotting code. I will demonstrate the basic issue with a pedagogical example, then mention a few common plots where this may arise, and finally some possible exceptions to the rule.
